Esri: Viewpoint Q&A with Terry Bills
6/4/2024
SPECIAL ADVERTISING SECTION
Terry Bills

Transportation Industry Director
Esri
Redlands, CA


We sit down with Esri’s Transportation Industry Director Terry Bills. The Esri transportation team believes that GIS technology is critical to creating more inclusive transportation systems and helps design policies that address historical inequities.
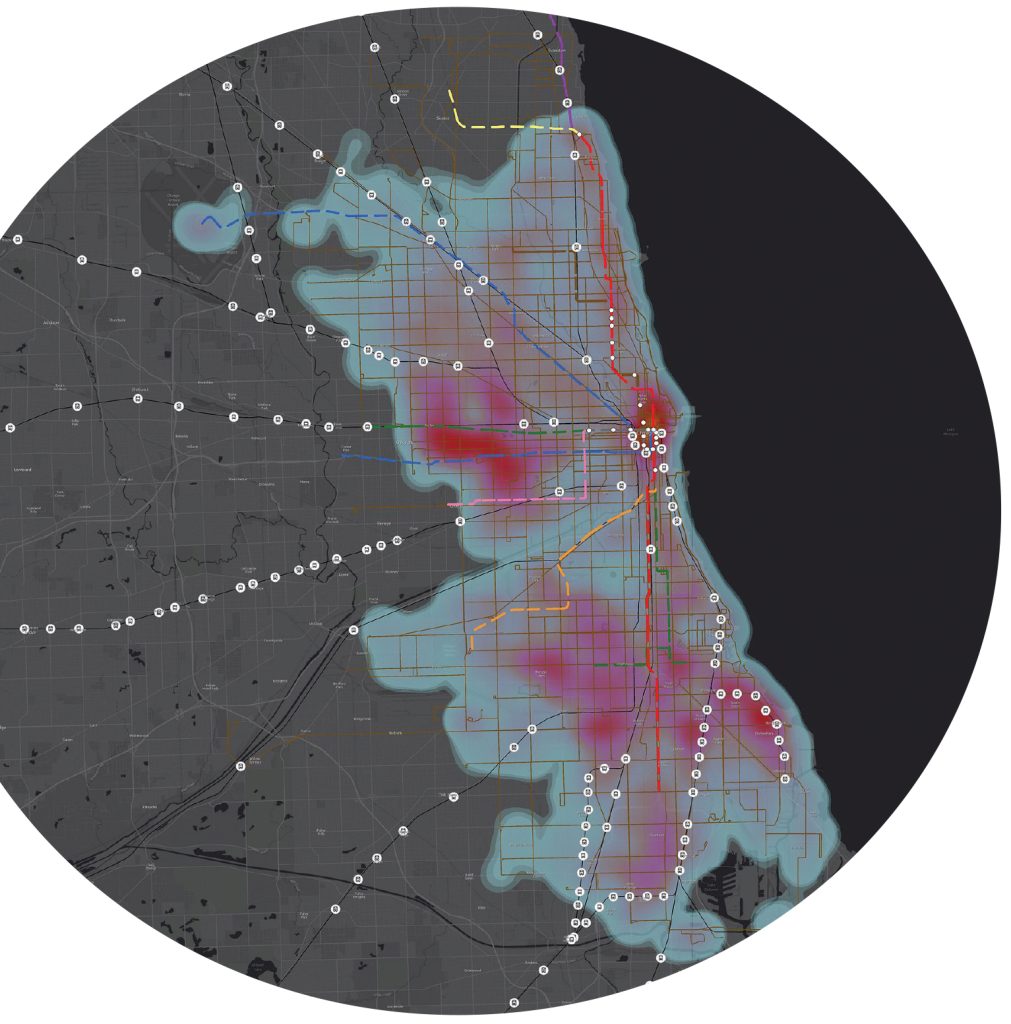
The first step in creating a more equitable transportation system is for agencies to understand equity priority communities, including their location and characteristics, and how each of these variables interact with each other.
Q: How can transportation organizations incorporate equity into their work?
Terry: I think that is the central challenge for transportation professionals in our current environment. With the passage of the Infrastructure Investment and Jobs Act (IIJA), we are making a once-in-a-generation investment in rebuilding our existing infrastructure and designing the infrastructure needed for the future.
Central to the IIJA is the concept that “equitable and safe access to transportation is a civil right.” Operationalizing that into our transportation investments is the task ahead of us.
Using GIS and detailed demographic data, many public transit agencies can better understand their communities, the mobility needs of specific populations in need, and use that information to design targeted public transit services for these populations.
Q: What transportation organizations are successfully prioritizing equity in this area?

Terry: We have any number of great examples in the public transit arena as we mentioned. The Oakland Department of Transportation did some exemplary work creating their Geographic Equity Toolkit (go.esri.com/OakGET), which they used to identify priority neighborhoods for greater investment. Much of the analysis for this effort was conducted by Jeffrey Tumlin of Nelson Nygard, and when he became the Executive Director at San Francisco Municipal Transportation Agency, they similarly launched an equity initiative to guide their service delivery and build greater “ladders of opportunity” within the city (go.esri.com/GIS4SFMTA).
Another outstanding example comes from the Centralina Regional Council who together with consultant HDR, helped define an equitable mobility plan for a widely diverse area. Their CONNECT Beyond Regional Mobility Plan (go.esri.com/GIS4CRC) is intended to provide a comprehensive understanding of the region’s population.
In addition, several transportation agencies have hired Chief Equity Officers to help focus their efforts and meet requirements of the IIJA as they move forward.
Q: What data and information are most useful for transportation organizations to consider as they seek to advance equity in their work?
Terry: There are really two sides to that question. In the first instance, transportation professionals need to define the characteristics that make up the communities in need and understand their geographic location.
The public transit examples above I think really set the gold standard for this type of analysis. By combining detailed demographic data with other rich information datasets from Esri, transportation agencies can gain a rich understanding of the diverse communities in their service area.
Once transportation professionals and their community partners have identified priority equity communities, the next step is understanding the transportation needs and requirements of those individuals and households. Numerous studies have documented the “spatial mismatch” of many US cities, where a disconnect exists between where low-wage workers live and which jobs they have access to via transportation, making it difficult for job seekers to find and keep jobs and for employers to find and retain employees.
It is not just access to jobs that are critical to understand, but just as importantly, access to healthcare, shopping, educational opportunities, and understanding access by time of day. Esri technology provides powerful analytical tools, to help transportation professionals understand local transit accessibility issues and analyze accessibility to workplaces and other important locations.
Q: How does ArcGIS differ from other technology used to enhance equity within transit organizations?
Terry: Many public transit agencies have not leveraged the data and analytical capabilities of ArcGIS to help them better understand their communities, and the specific mobility requirements of these various communities.
We feel there are four key areas where GIS can help transportation agencies define and build more equitable transportation systems.
- First, as we have mentioned, is to map and understand community inequities, and understanding the location of neighborhoods and communities to target.
- Secondly, there are a range of new data sources based on anonymized cell phone data that together with GIS, can give us a more complete picture of how individuals and households move through our urban environments.
- Third, overlaying an equity lens with ArcGIS on these existing practices will help define new strategies for investments to redress past inequities and build more equitable transportation systems.
- Finally, we want to monitor the performance of our practices and investments, to ensure they are having the desired impact. Performance monitoring has become standard in many transportation agencies and provides a valuable feedback loop back into our planning processes. GIS is a central component for monitoring and visualizing our progress towards a more equitable future.
I am highly optimistic that through the IIJA and the Justice Forty Initiative, we will begin to redress historical inequities, and make significant progress on building more equitable transportation systems for the future.
For more information download our brochure at, go.esri.com/GIS4TransitEquity.